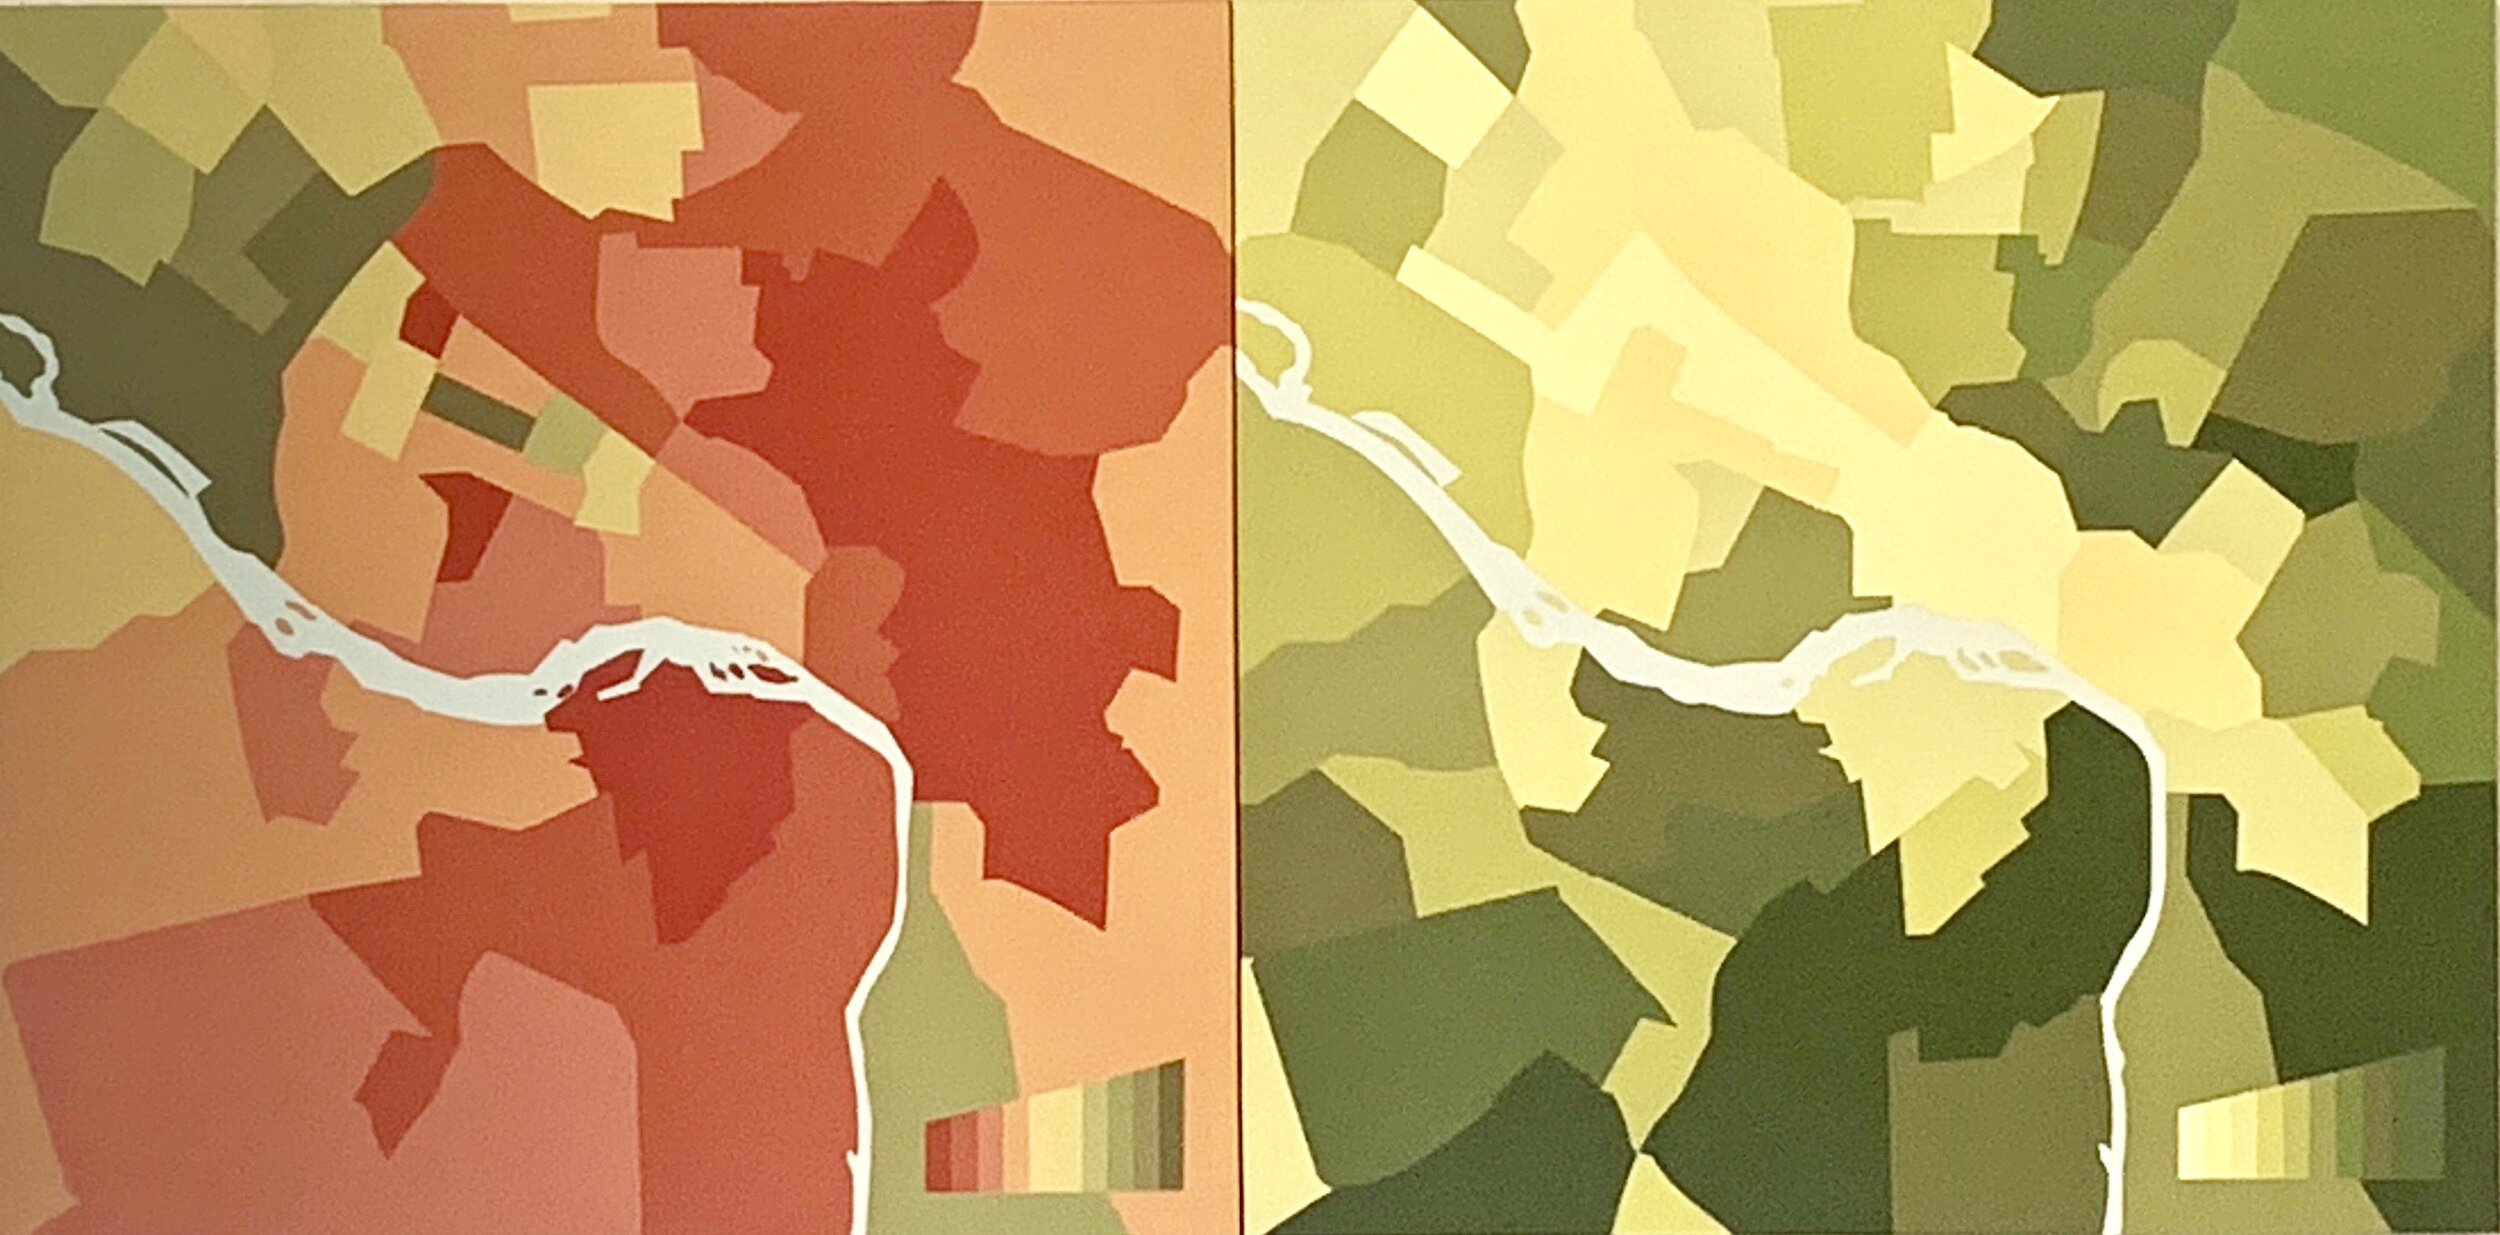
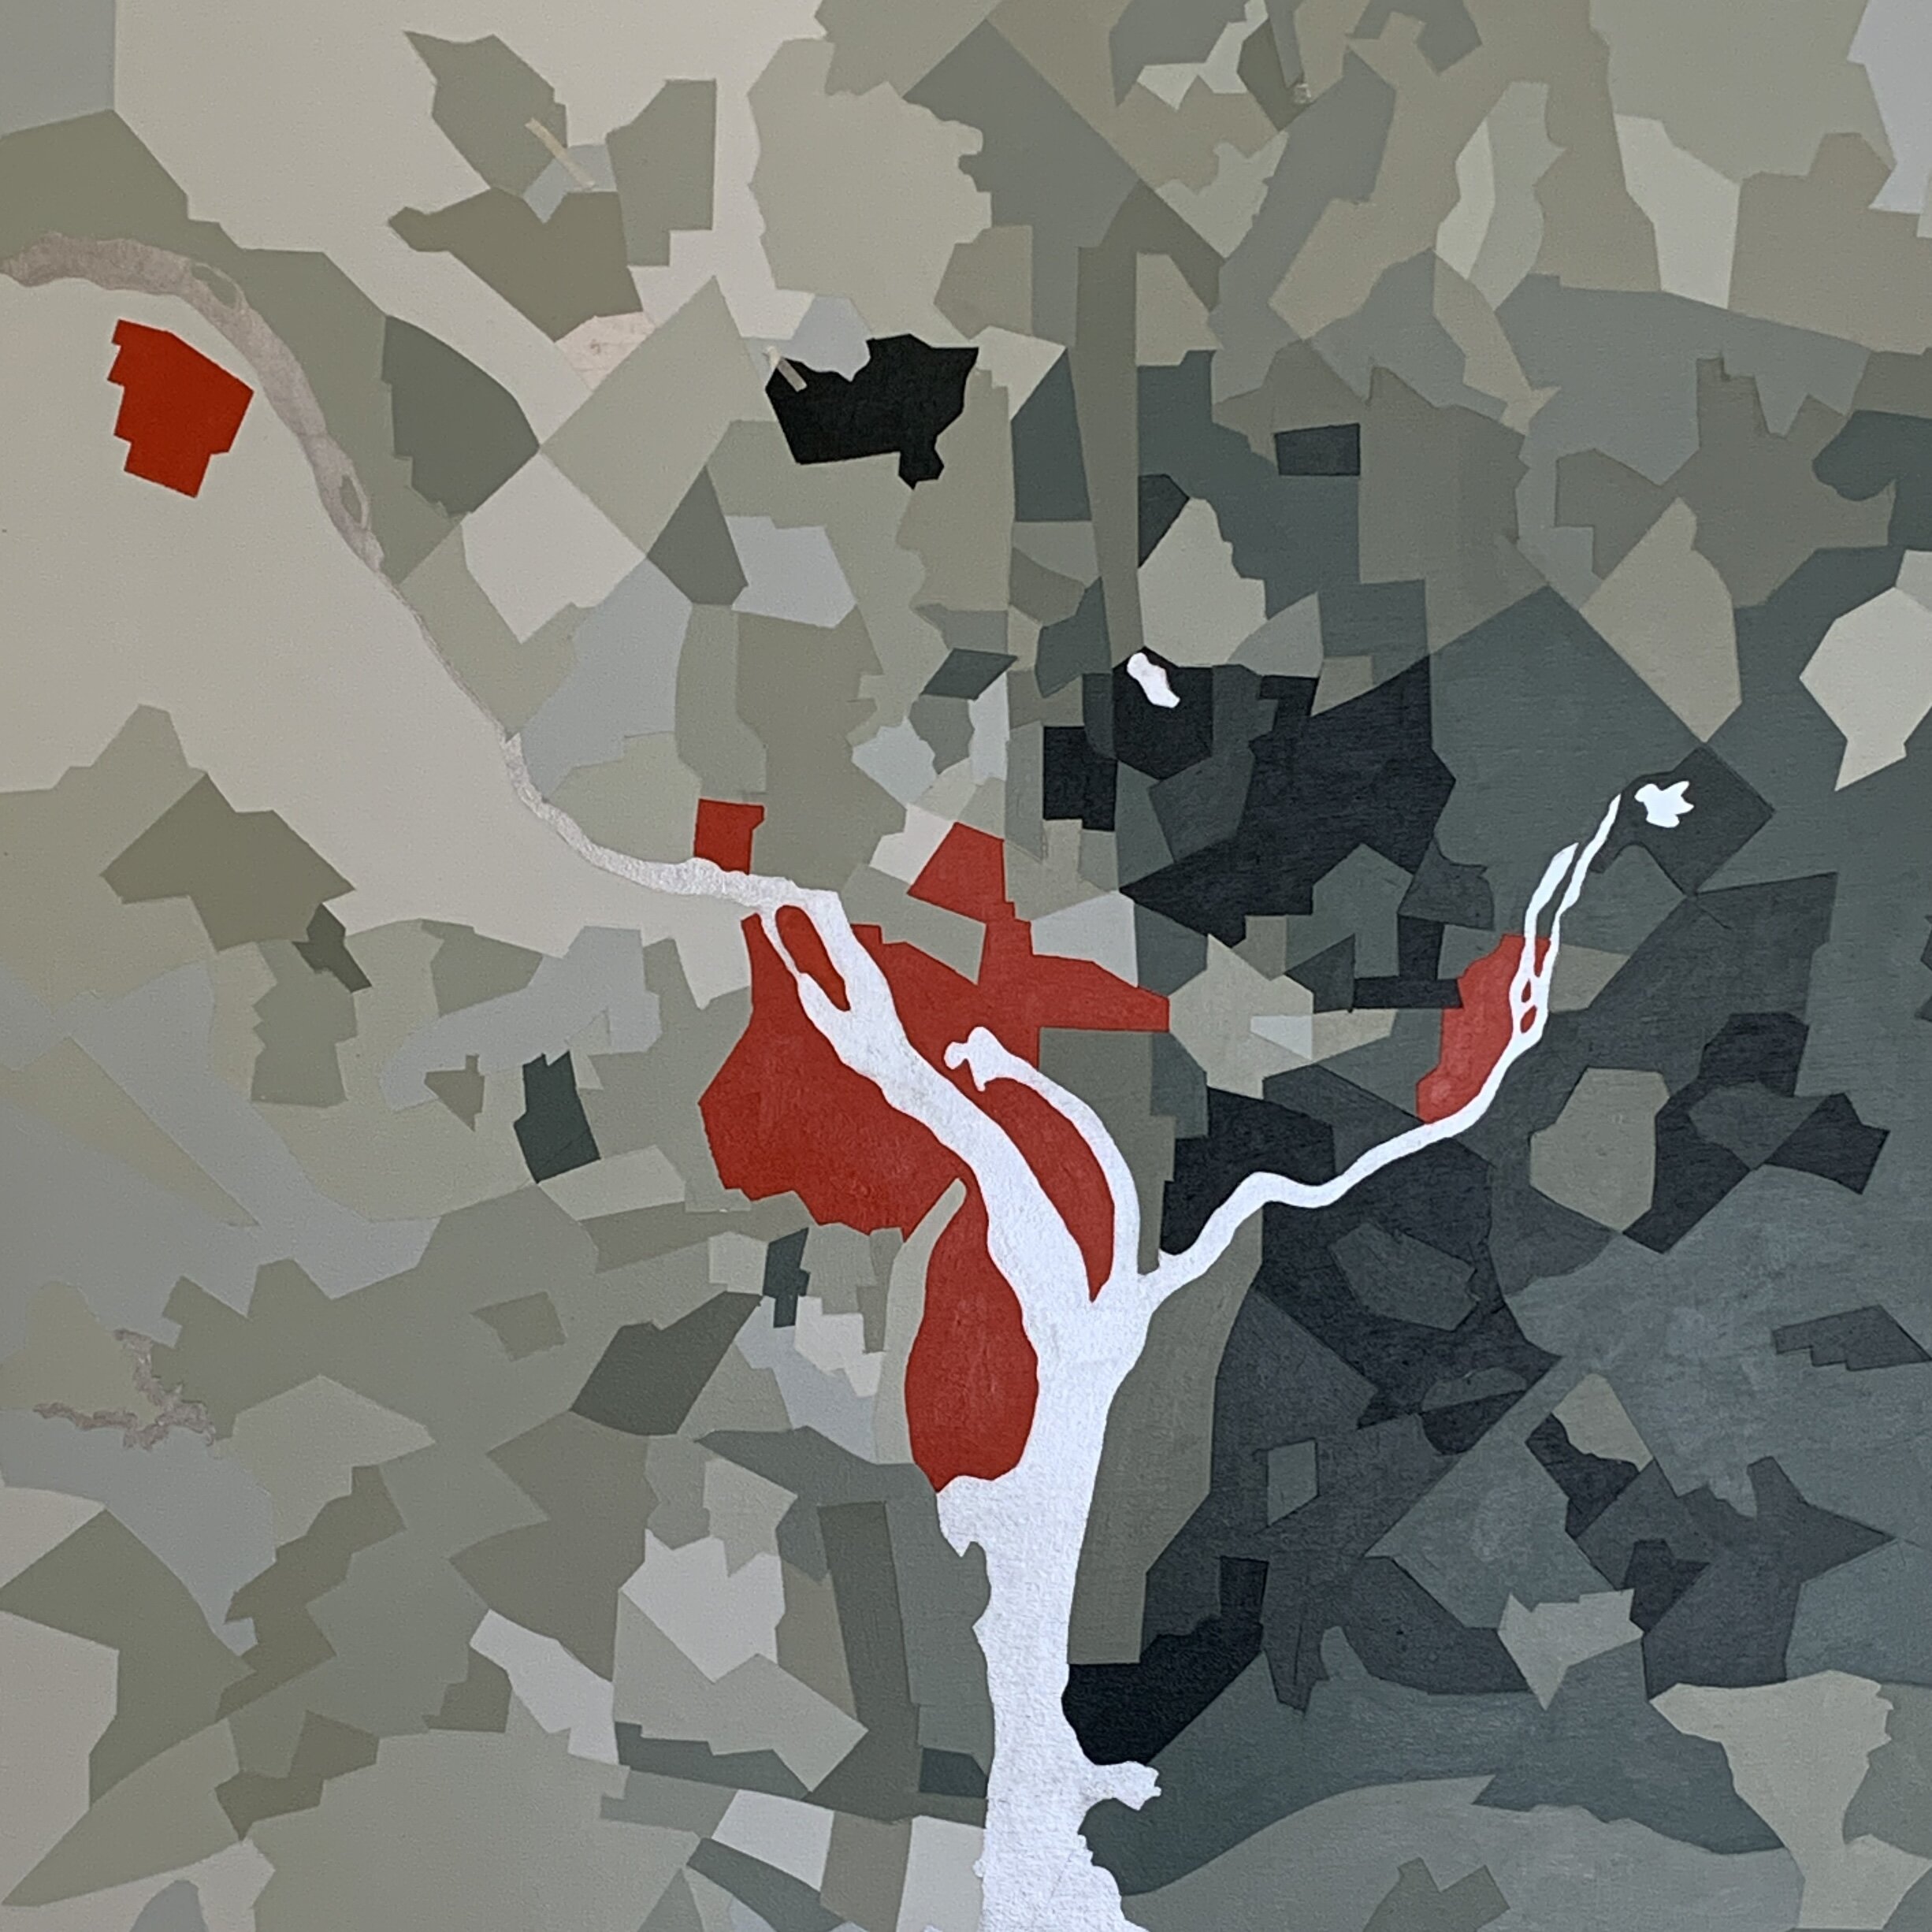
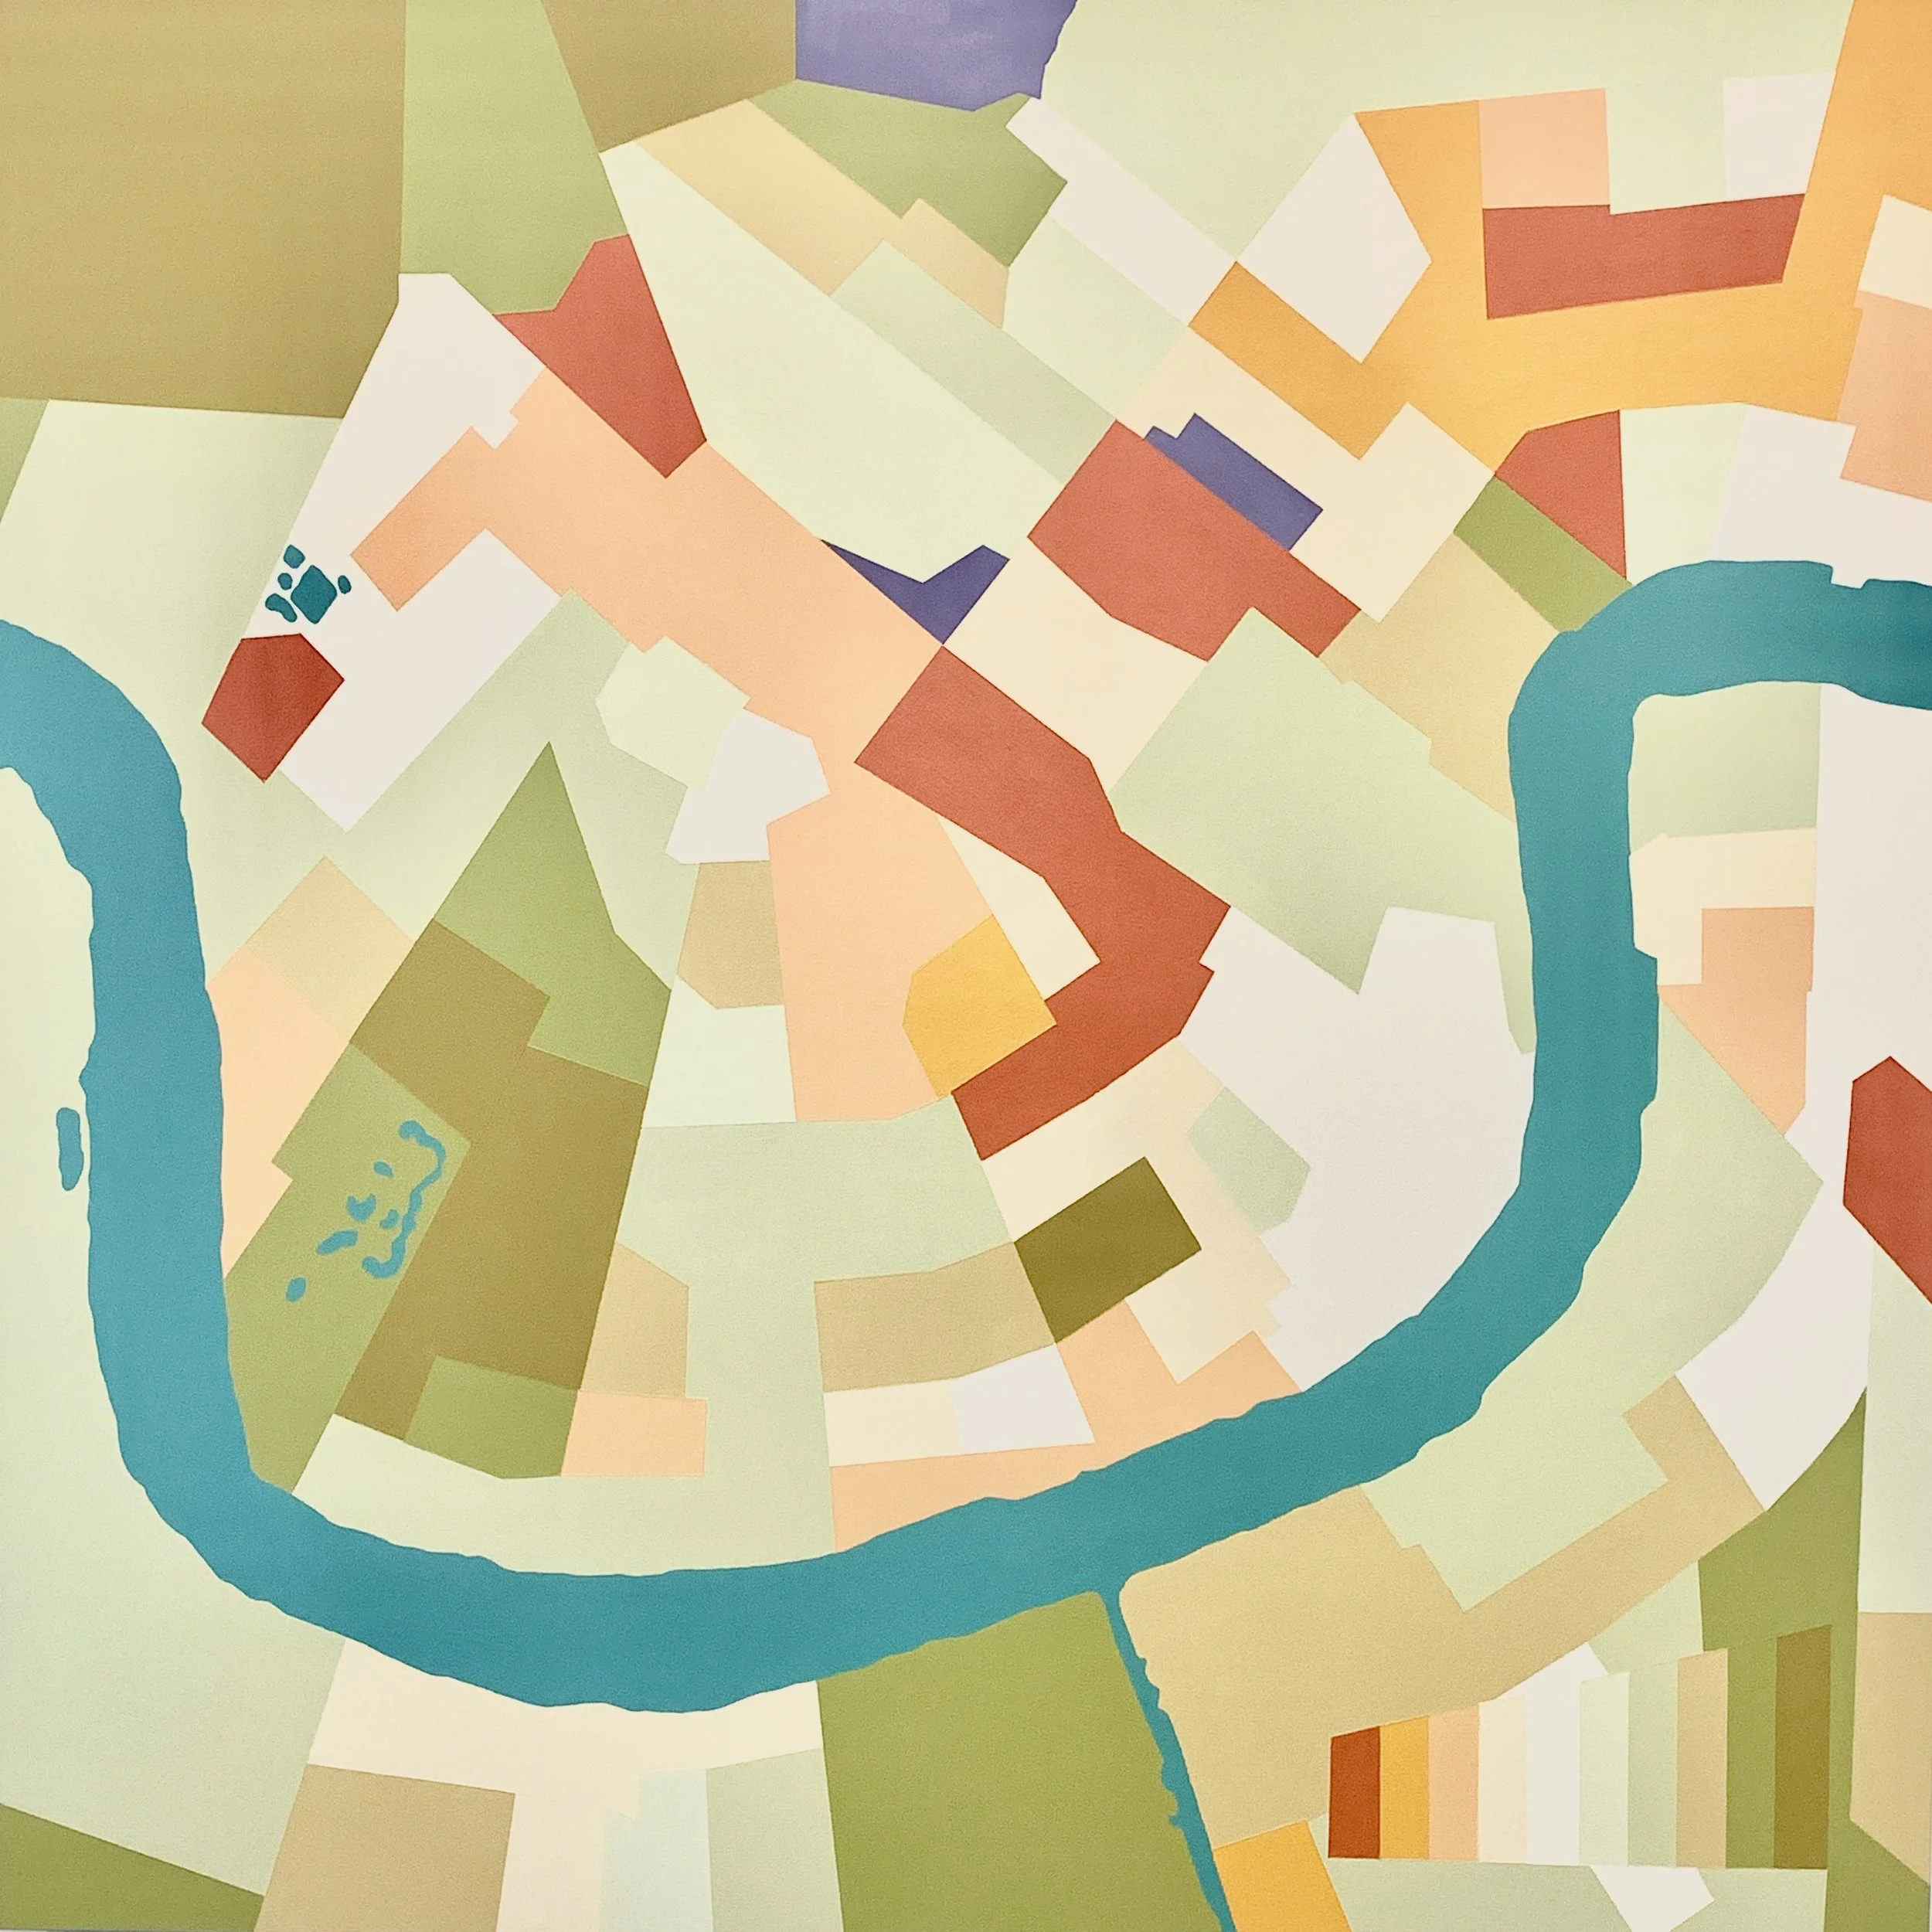
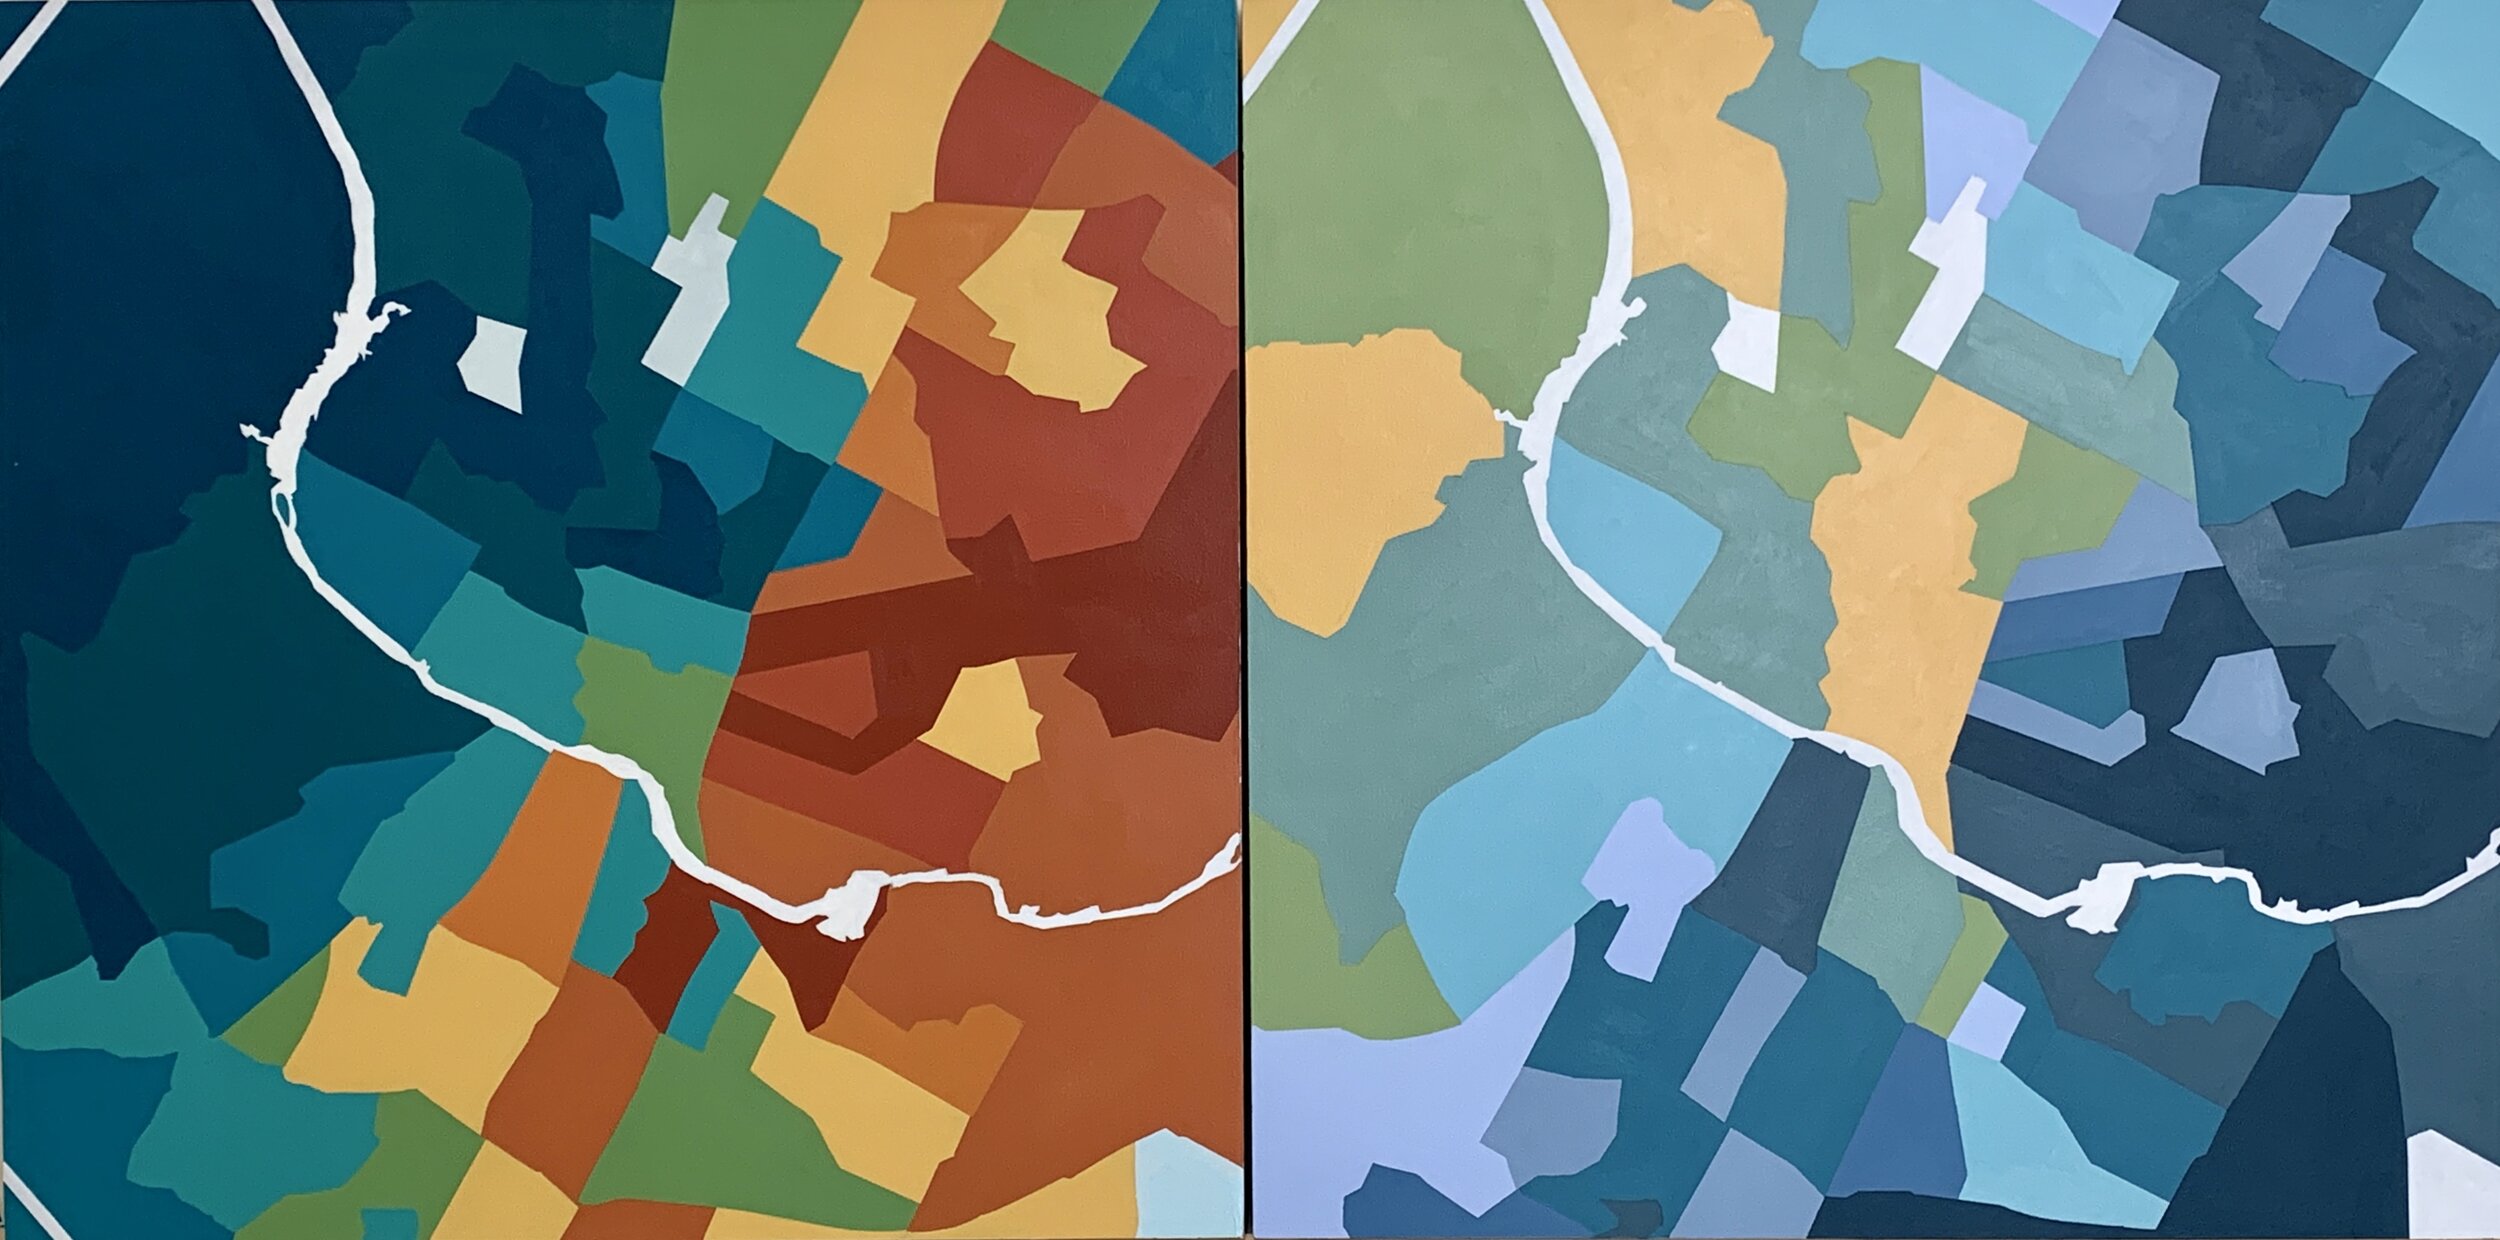
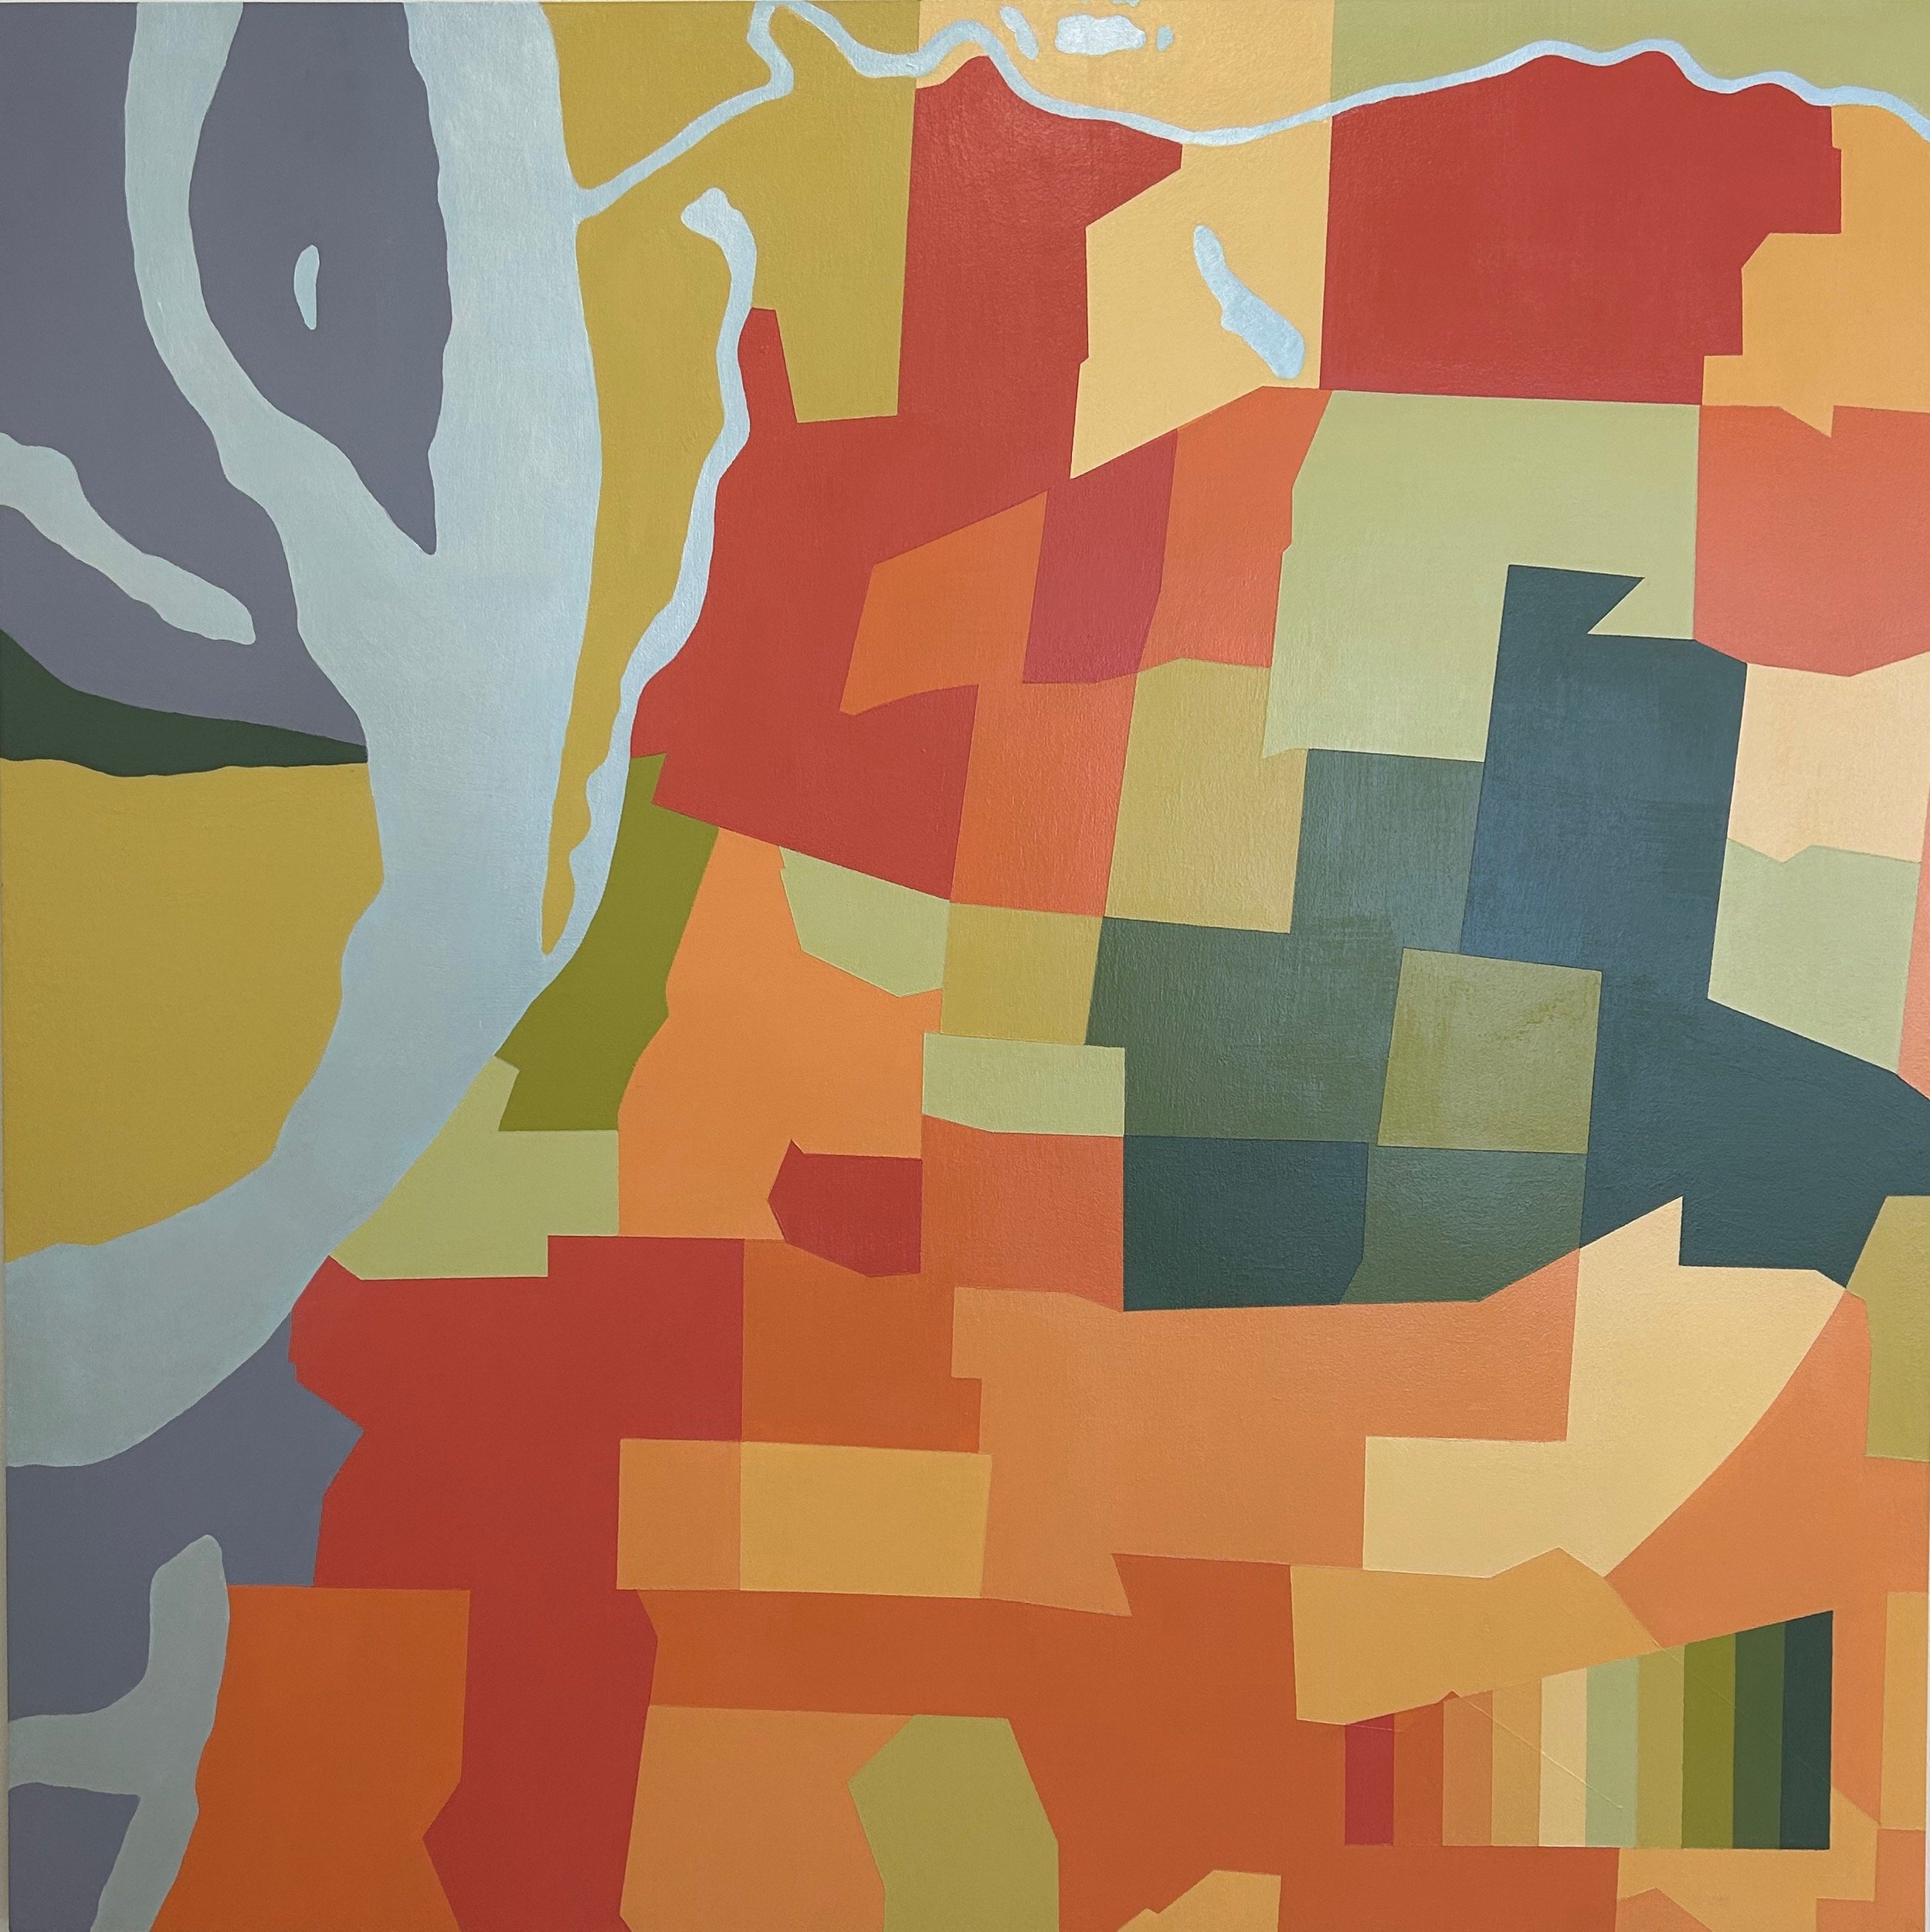
Many of these paintings are based on the Opportunity Atlas, an exhaustive study by the US Census Bureau and Harvard University, that attempts to map outcomes in adulthood back to the neighborhoods where low-income children grew up. They tell unique stories and reveal common themes in the ways that American cities have developed.
Diptych, Acrylic on Panel 48” x 24”
These paintings depict the Opportunity Atlas maps of Richmond VA. The painting on the left shows the household income in adulthood of people who grew up in low-income households in each neighborhood between 1979 and 1983, highlighting the upward mobility associated with individual neighborhoods. The painting on the right shows the total number of children living in each neighborhood, revealing a disheartening fact that most children live in neighborhoods with the least upward mobility. Richmond is a city of contrasts: despite being home to Fortune 500 companies, having low unemployment, and strong job growth, almost a fourth of its households are below the Federal poverty line. The city’s child poverty rate of 39% is more than double the state's average, and its eviction rate is the fourth highest in the country
Acrylic on Panel 20” x 20”
This map of Washington D. C. depicts average household income in adulthood of children who grew up in each neighborhood in the early nineteen-eighties. Using the color palette of a twenty-dollar bill, it illustrates the sharp contrast in economic opportunity between neighborhoods on the west side of the Potomac River and those on the east.
Diptych, Acrylic on Panel, 20” x 40”
This pair of paintings compares cities of similar size – Des Moines, Iowa and Greensboro, NC. Both are situated in historically agrarian areas and both have economically diverse urban cores. However the prospects for upward mobility differ dramatically in their exurbs. Des Moines is a mid-west farm-belt city, surrounded by prosperous family-owned farms. Greensboro’s economy, historically based on tobacco, textiles and furniture, is transitioning to a more serviced-based model; but areas outside of the city seem to be left behind.
House Paint on Panel 40” x 40”
This painting of New Orleans highlights variations in household income in adulthood, mapped back to the neighborhoods where children grew up. It is a visual representation of the opportunity for upward mobility afforded by each neighborhood. The colors carry meaning: warm shades indicate lower income, while cool shades indicate higher income. My hope is to shed light on the diverse economic conditions and opportunities that exist in different areas of the City.
Diptych, Acrylic on Panel 48” x 24”
Based on the Census Bureau’s Opportunity Atlas, this pair of paintings depict Austin, TX. The painting on the left shows the household income in adulthood of individuals who grew up in low-income households in each census tract in the early 80’s, indicating the upward mobility associated with specific neighborhoods. The painting on the right depicts the total number of children living in each neighborhood. Sadly, more children live in neighborhoods with more limited prospects. Austin is considered a success story due to its low unemployment and high rate of job growth. Yet there are parts of the City that don’t participate in its overall success.
House Paint on Panel 40” x 40”
This map of Memphis, TN, is based on the Opportunity Atlas, an exhaustive study by the Census Bureau and Harvard economists that attempts to measure differences in upward mobility based on geography. Like so much of America, Memphis’ story is one of in and out migration – the movement of people driven by opportunity and hardship. In the 1840’s it was a haven for Irish immigrants escaping the Great Famine. As a Union stronghold during the Civil War, it provided refuge to thousands of fugitive slaves from surrounding plantations. However, inevitable racial tension between Irish police and black former Union soldiers and freedmen culminated in the Memphis Riot of 1866 in which white mobs attacked black neighborhoods in south Memphis causing many black residents left the city permanently. In one particularly devastating yellow fever outbreak in 1878, Memphis lost over half its population in 3 months as more prosperous white residents fled and poor whites and blacks succumbed to the disease. Throughout the early 20th century, Memphis remained at the center of the struggle for racial equity. It was the site of many civil rights protests, including the famous sanitation workers strike in 1968 that brought Martin Luther King to the City, where he was assassinated. Fearing violence, many white residents left the city, and more followed in the wake of court-ordered bussing in 1973. Today, Memphis is 64% black and 24% white and is one of the most segregated cities in the country. It is one of the poorest cities in the United States.
Diptych, Oil and Acrylic on Panel 32” x 16”
These maps of Charlotte, NC are drawn from the Census Bureau’s Opportunity Atlas project. The map on the left shows the household income in 2010 of children who grew up in low-income households in each census tract between 1979 and 1983. The map on the right shows the total number of children in each tract. Note the greater concentration of children in neighborhoods with the least upward mobility.
Diptych, Acrylic on Panel, 20” x 60”
The painting on the left depicts the 1940’s Home Owners Loan Corporation’s infamous “red line” map, intended to steer investment away from less desirable areas. Many waterfront areas were identified as Grade D based on their propensity to flood and on the “infiltration of undesirable foreign-born whites, Negroes and relief families”. The map on the right shows the percentage of population living below the poverty level for each census tract in 2016, revealing the troubling connection between discriminatory lending and current wealth disparity.
Diptych, Acrylic on Panel, 30” x 48”
These paintings juxtapose two maps of Milwaukee, WI. On the left is the infamous “red line” map created by the Home Owners’ Loan Corporation as part of Roosevelt’s New Deal. It shows areas that were to be avoided by responsible lenders. On the right is Opportunity Atlas map based on the 2010 Census, showing the household income in adulthood of people who grew up in low-income households in each census tract in the early 80’s. For almost 100 years the HOLC set the rules for real estate practice and directed public and private capital towards white native-born populations and away from Black and immigrant families. Along with subsequent government-sponsored programs, they denied certain groups’ access to the most significant means of intergenerational wealth-building in the U. S.
16” X 16” Acrylic and Decoupage on Panel
Created from painted pages of Alexis De Toqueville’s famous text, this map of Georgia shows the 2020 Presidential Election outcomes by precinct. Blue indicates a preponderance of Democratic votes while reds indicates Republican.